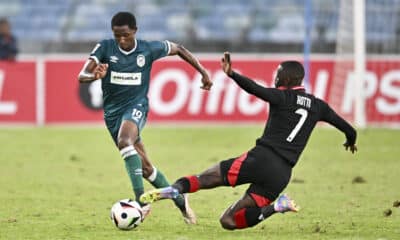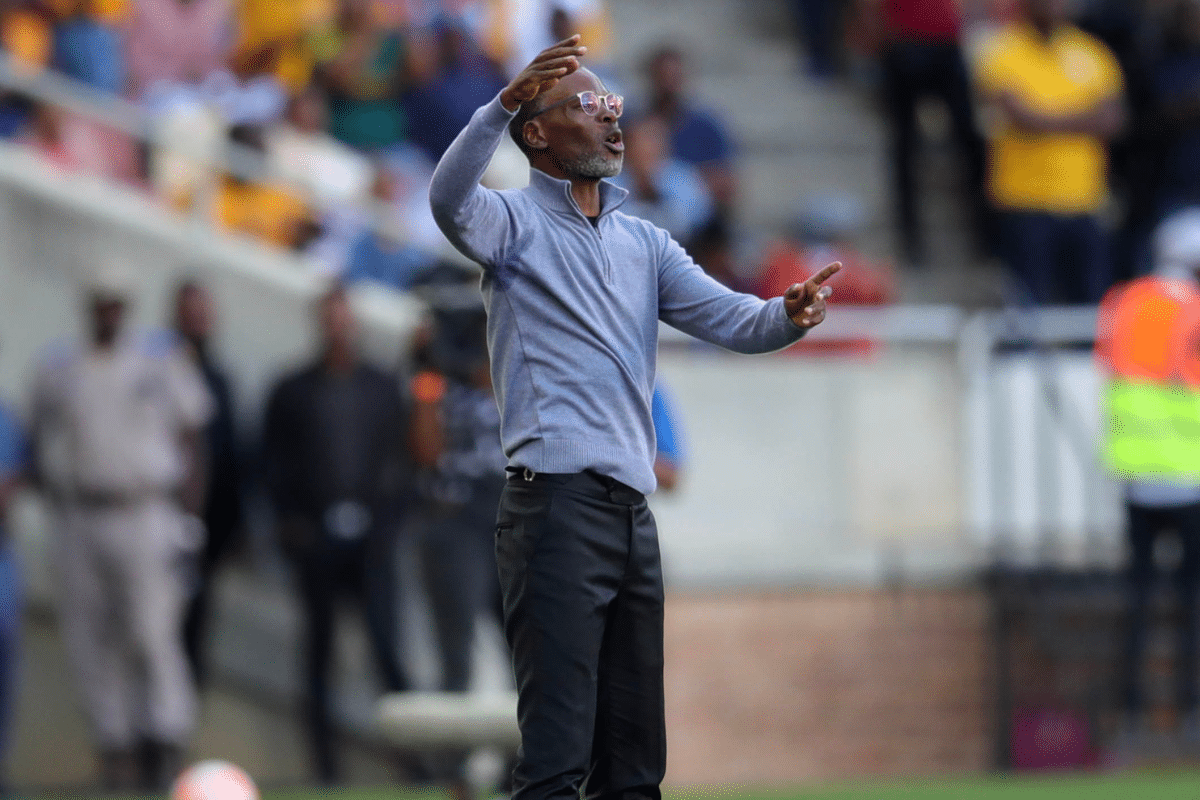
Kaizer Chiefs were knocked out of the Nedbank Cup on Saturday afternoon, with a headed goal from Sandile Mthethwa towards the end of extra time decisive for rivals Orlando Pirates. It was Chiefs’ last hope of silverware for the campaign, and it will now be eight seasons without a trophy for them. Post-game, Arthur Zwane said many things, one of which caught our (and many people’s) attention.
“When you look at the stats, they always say stats don’t lie. Go and check the stats of Kaizer Chiefs’ last three seasons then you will see that there’s a lot of improvement in this squad compared to the previous squads that we have assembled.”
We went about exploring the veracity of this statement. On a general level, there is some truth in the statement. Chiefs have gone further in each of the Cup competitions than they did last season. One win in their last two games will ensure a higher position than any of the last two seasons (8th and 5th), and they still have a chance to get to the 50-point mark, which would also be better than the last two terms. Although the defence has been leaky, Chiefs could still end up with a better clean sheet count than last season, even though they’ve already conceded more goals.

Their win and goal totals will likely improve, but we’re talking fine margins – nothing much to be excited about. Yet, the attacking side of things is what the coach was probably referring to – and we’ll focus on that here. There is, of course, considerable anger about their current situation, although CAF qualification may ease that angst. It would need some favorable results to bring that about, but we can’t rule that out yet, especially given that they face SuperSport on the weekend.
Attacking
Kaizer Chiefs’ 4th place is not particularly reflective of their underlying performances. In fact, by expected goals, they seem more like a 2nd-placed side. A quick look at their xG difference (+17) shows they are the second most effective team in the Premier League, behind Sundowns (+22). When you consider the xG per match, Chiefs actually have the highest xG in the PSL at 1.7 per match. These are the kinds of numbers you’d expect for a team competing for the title itself, but Chiefs haven’t even topped the table for one day this season (eight sides have). When looking at xG, we have to take into account the number of penalties they’ve received (seven is the most). Even then, Chiefs do down one place to third in xG behind Sundowns & Cape Town City, although the gap grows.
Another way to interpret Chiefs stats is to look at the trendlines over the last couple of seasons (the gold line indicates a change in season).
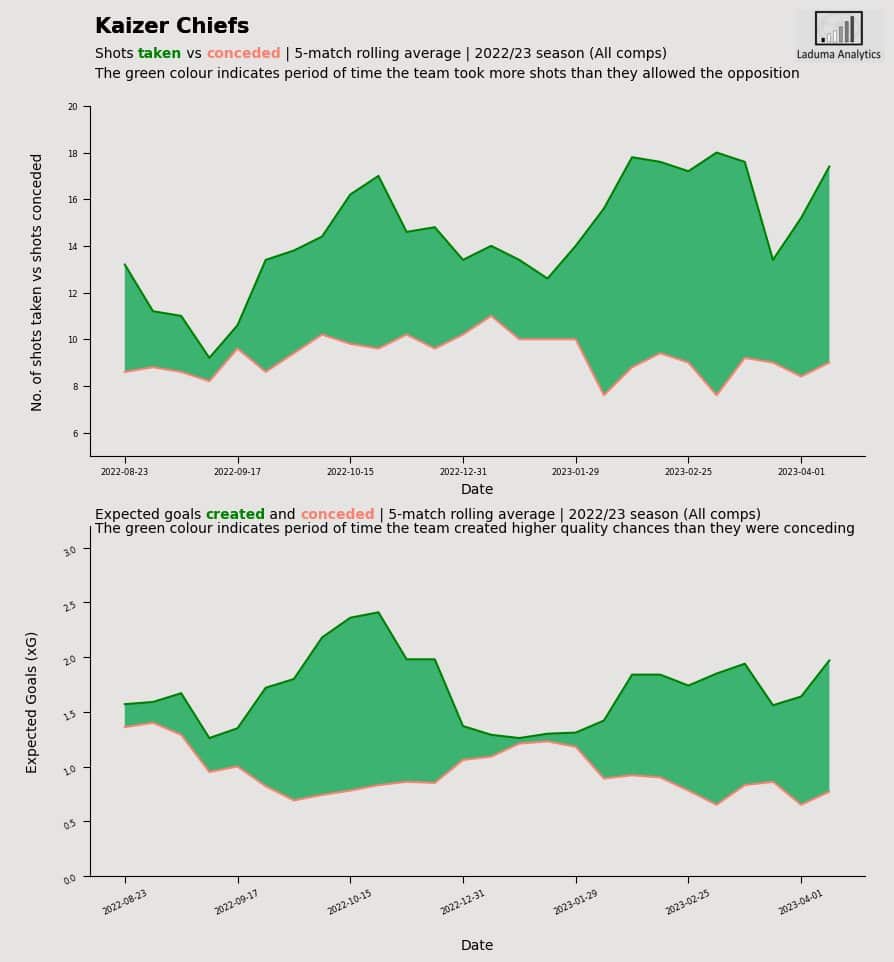
It is interesting that Coach Zwane chose the three-season period, a tacit acknowledgment to Ernst Middendorp’s 2019/20 side that came so close to a title. A ten-game rolling average of their xG and xG conceded shows the inconsistency that they’ve struggled with over the years. Whenever they are on fire, they struggle to keep up that form. For example, after playing extremely well at the end of last season (the blue line going up), they continued in the same vein in the first half of the season.
In the second half, they started to fall off a little again. Having said that, underlying numbers are more than just xG. The radar below compares the last two seasons in a few attacking metrics. The volume of shots and shot quality has gone up significantly. They are also more adventurous with long-range shots (thanks Yusuf Maart) and taking slightly more touches in the opposition box.
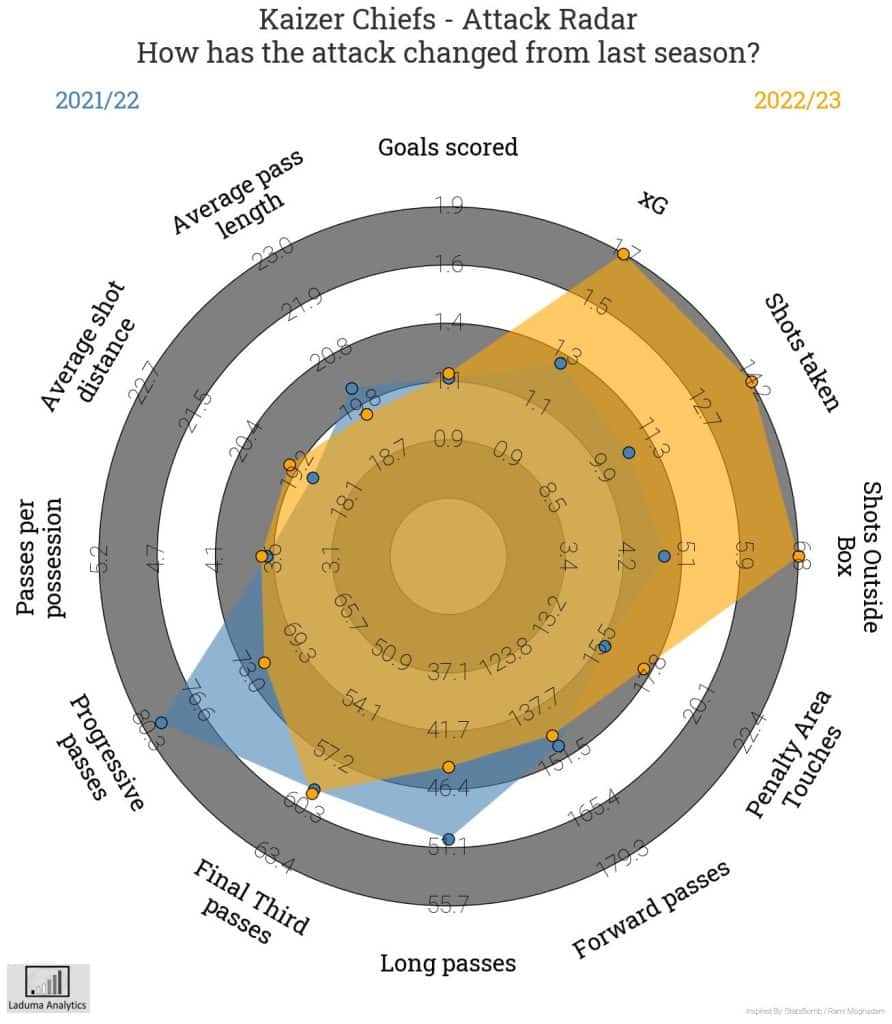
There are a few areas that have gone down from last season, but these may be more indicative of changes in the style of play and personnel availability. The average pass length has decreased, together with the volume of progressive passes and long passes per game. Tactical choices and personnel decisions may reveal tangible reasons for some of these changes.
The Bigger Picture
The dashboard below gives a fuller picture of Chiefs’ trends over the last few seasons, including possession, shooting, and an aspect of defence. On a possession level, Chiefs are having less of the ball and attempting fewer passes. Again, a secondary question would be whether that is by design or responsive. Their box entries, shot volumes, and quality are on the up, but there is an indication of less aggression when it comes to defending higher up, allowing opponents around two more passes before initiating a defensive action.
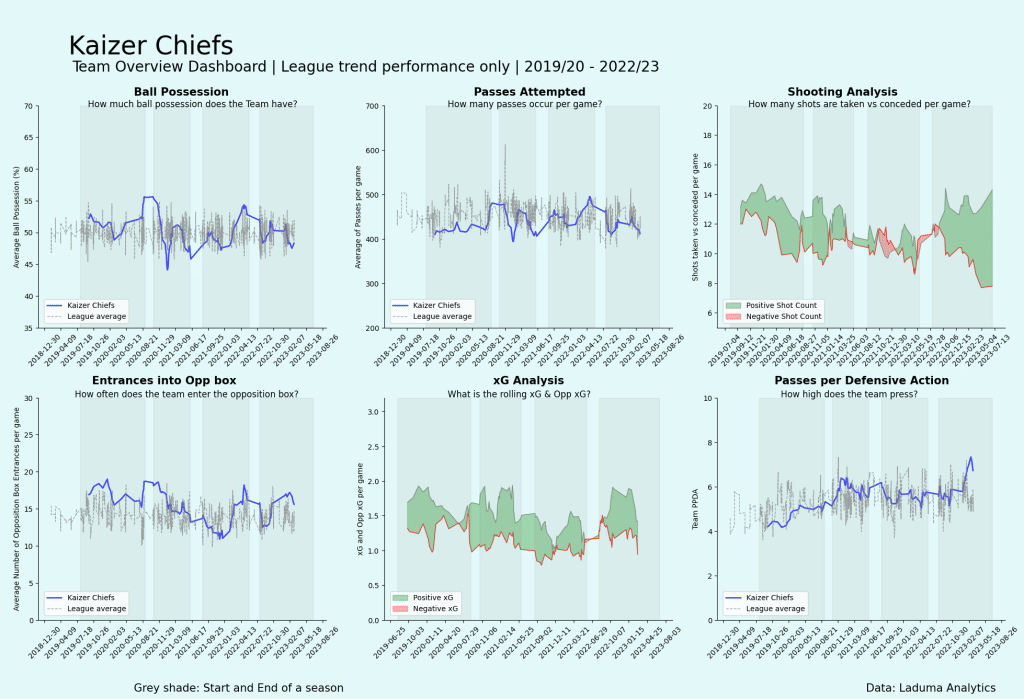
Have the numbers improved? Yes. And No. There are some stats that have improved at Chiefs. And there are others that have gotten worse. The better question is – have the stats that matter improved, and are the improvements predictive of a brighter future. In other words, will they take Chiefs closer to becoming a 60-point team? The Coach may be basing his assertion on stats that show the process is working, but the league doesn’t hand out titles for the best process. Chiefs have had the highest and 2nd highest xG for a few years now, but the struggle to finish off what has been created remains – high xG has not translated to more goals. At some point, that becomes a worry. No team can win the title averaging one goal a game. Indeed, management may keep faith in processes, but that faith is going to be sorely tested in his second season.


